Returns color palettes for vitalBayes plots. The default palette is derived directly from the package hex sticker's retro-wave/synthwave aesthetic. Colorblind-friendly alternatives are provided based on established research (Okabe-Ito, viridis, and Paul Tol's schemes).
Usage
vital_colors(
  n = 5,
  palette = c("default", "sex", "gradient", "sunset", "okabe_ito", "viridis",
    "tol_bright", "sex_cb")
)
Arguments
- n
Integer. Number of colors to return. Default returns all available colors in the selected palette.
- palette
Character. Which palette to use:
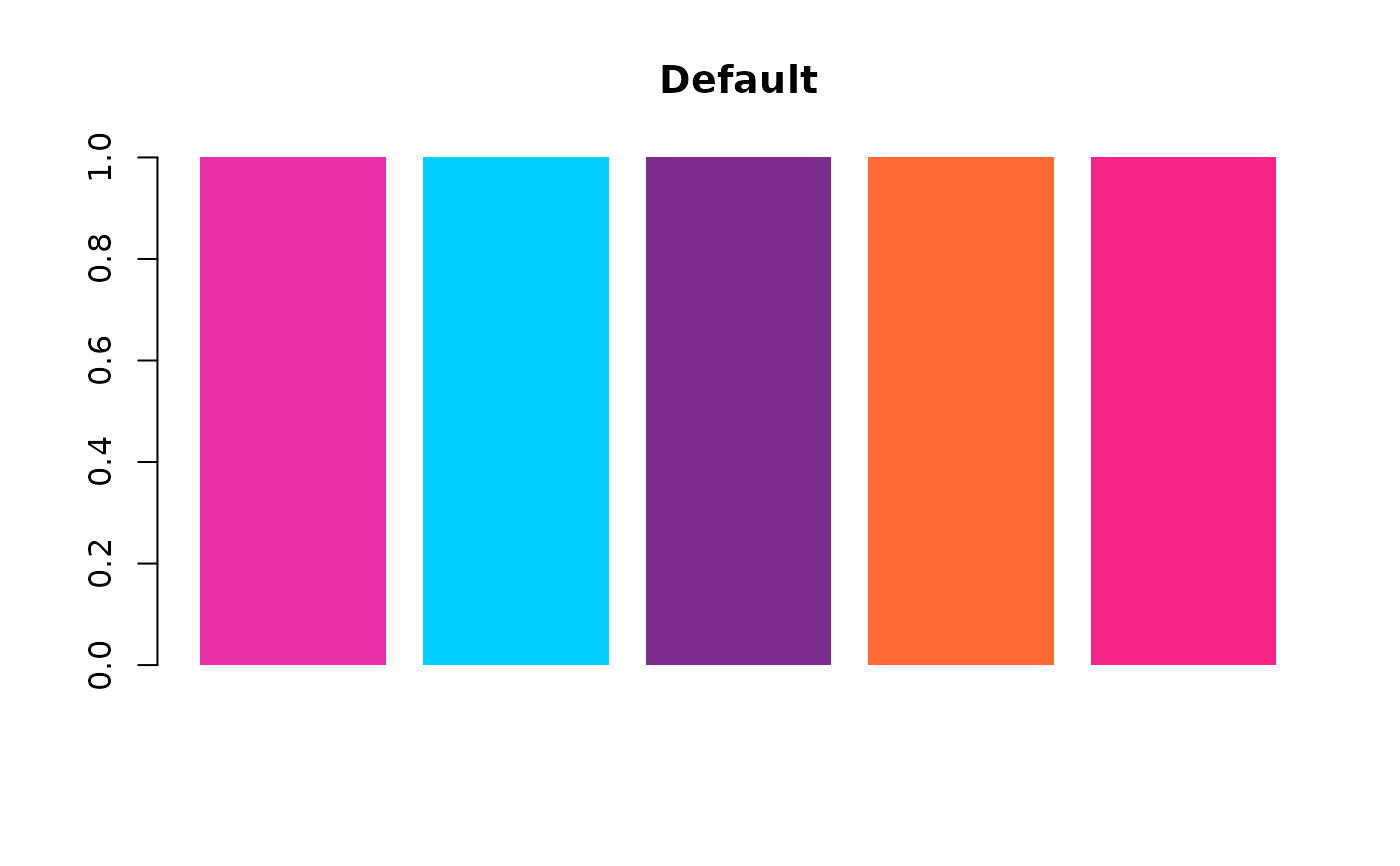
"default"Full retro-wave palette from logo (5 colors)
"sex"Female (magenta) / Male (cyan) for two-sex models
"gradient"Smooth gradient from pink to cyan (6 colors)
"sunset"Warm sunset tones from the logo's sun element
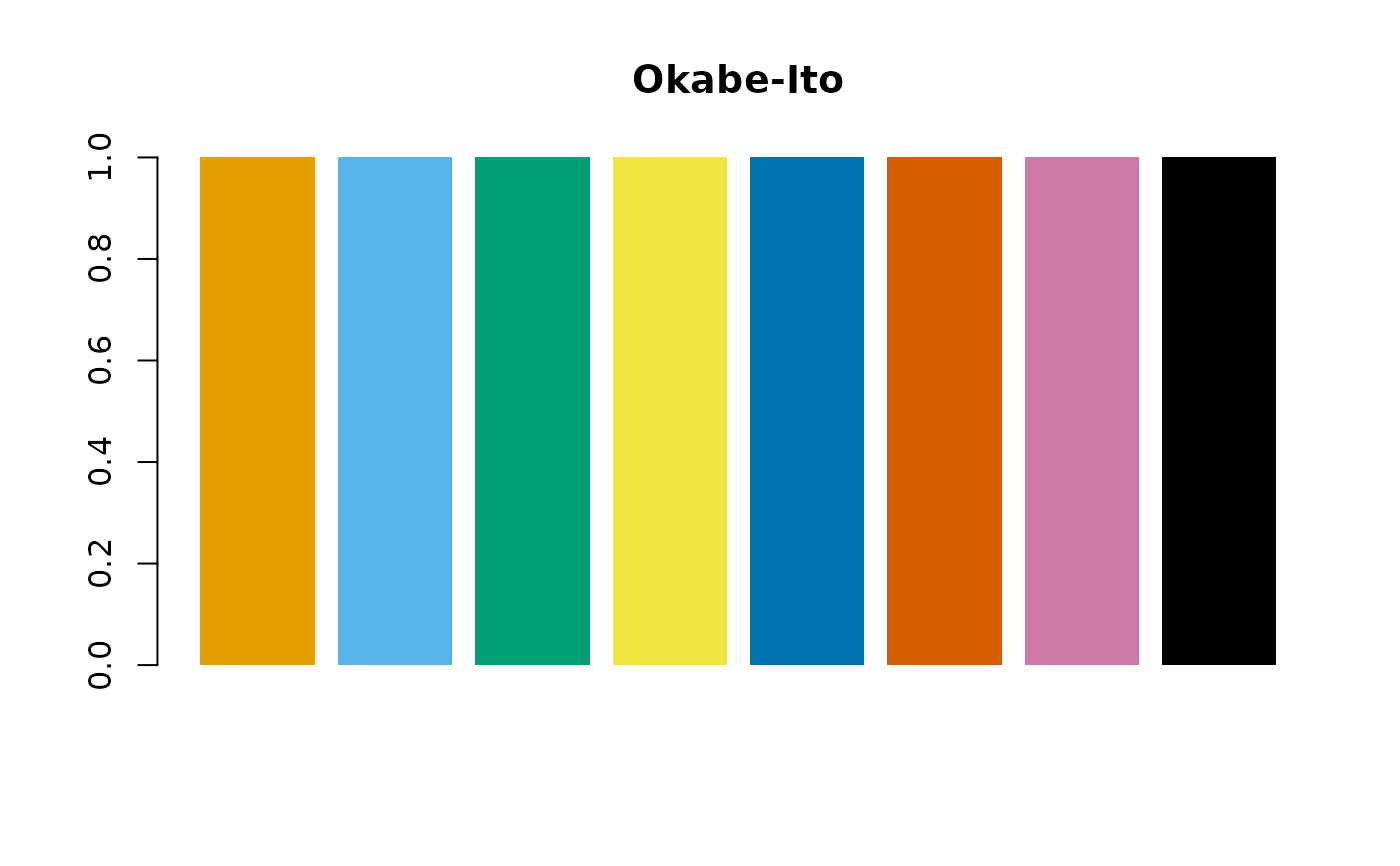
"okabe_ito"Colorblind-safe Okabe-Ito palette (8 colors)
"viridis"Colorblind-safe viridis-inspired (5 colors)
"tol_bright"Paul Tol's colorblind-safe bright scheme (7 colors)
"sex_cb"Colorblind-safe sex palette (orange/blue)
Colorblind Accessibility
The "okabe_ito", "viridis", "tol_bright", and "sex_cb"
palettes are designed to be distinguishable by individuals with the most common
forms of color vision deficiency (deuteranopia, protanopia, tritanopia).
For two-sex models in publications requiring accessibility, use "sex_cb"
which employs orange (female) and blue (male) - the most robust color combination
for all forms of color blindness.
References
Okabe M, Ito K (2008). "Color Universal Design (CUD): How to make figures and presentations that are friendly to Colorblind people." https://jfly.uni-koeln.de/color/
Tol P (2021). "Colour Schemes." SRON Technical Note. https://personal.sron.nl/~pault/
Examples
# Default vitalBayes palette
vital_colors()
#> [1] "#E930A7" "#00CFFF" "#7B2D8E" "#FF6B35" "#F72585"

# Two-sex models
vital_colors(2, "sex")       # Default pink/cyan
#> [1] "#E930A7" "#00CFFF"
vital_colors(2, "sex_cb")    # Colorblind-safe orange/blue
#> [1] "#E69F00" "#0072B2"

# Colorblind-safe palettes for multi-group comparisons
vital_colors(4, "okabe_ito")
#> [1] "#E69F00" "#56B4E9" "#009E73" "#F0E442"
vital_colors(5, "viridis")
#> [1] "#440154" "#3B528B" "#21918C" "#5DC863" "#FDE725"

# Preview palettes
barplot(rep(1, 5), col = vital_colors(5), border = NA, main = "Default")

barplot(rep(1, 8), col = vital_colors(8, "okabe_ito"), border = NA, main = "Okabe-Ito")